Business Case:
LIDAR Technology in Utilities and Telecommunications

Executive Summary
Light Detection and Ranging (LIDAR) technology represents a significant advancement in infrastructure management and maintenance for utility and telecommunications companies. This analysis examines the costs, benefits, and return on investment of implementing LIDAR solutions across these sectors.
Market Overview
The global LIDAR market in utilities and telecommunications is experiencing rapid growth, driven by increasing demands for infrastructure modernization and the need for precise asset management.
Current market size exceeds $1.2 billion with an anticipated CAGR of 15.2% through 2030.
Implementation Costs
Hardware Investment
- Base LIDAR Equipment: $50,000-150,000 per unit
- Mobile Mounting Systems: $15,000-25,000 per vehicle
- Data Storage Infrastructure: $100,000-500,000 initial setup
- Maintenance and Calibration: $10,000-20,000 annually per unit
All of these costs can be eliminated using nfoldROI-4D Digital Twin as a Service (DTaaS)
Software and Integration
- – LIDAR Processing Software: $25,000-75,000 per license
- – System Integration: $150,000-300,000
- – Custom Development: $100,000-200,000
- – Annual Software Maintenance: 15-20% of license costs
Training and Personnel - – Initial Training Programs: $5,000-10,000 per employee
- – Specialized Staff Hiring: $80,000-120,000 per position
- – Ongoing Professional Development: $3,000-5,000 per employee annually
Mostof these costs can be eliminated using nfoldROI-4D Digital Twin as a Service (DTaaS)
Benefits and Value Proposition
Operational Efficiency
1. Asset Inspection and Maintenance
- 60% reduction in physical inspection time
- 40% decrease in maintenance planning time
- 30% improvement in asset lifecycle management
- Annual savings potential: $500,000-1,000,000
2. Network Planning and Optimization
- 45% reduction in network planning time
- 35% improvement in capacity utilization
- 25% reduction in network deployment costs
- Annual savings potential: $750,000-1,500,000
Risk Mitigation
1. Safety Improvements
- 50% reduction in workplace accidents
- 40% decrease in liability claims
- Annual savings potential: $300,000-600,000
2. Regulatory Compliance
- 70% reduction in compliance violations
- 45% decrease in audit preparation time
- Annual savings potential: $400,000-800,000
Revenue Enhancement
1. Service Quality Improvements
– 30% reduction in service interruptions
– 25% improvement in customer satisfaction
– Additional revenue potential: $1,000,000-2,000,000 annually
2. New Service Offerings
- Data monetization opportunities
- Consulting services potential
- Additional revenue potential: $500,000-1,000,000 annually
ROI Analysis
Financial Metrics
- Initial Investment: $500,000-1,500,000
- Annual Operating Costs: $150,000-300,000
- Annual Benefits: $3,450,000-6,900,000
- Projected ROI: 130-360% over 3 years
- Payback Period: 1.5-2.5 years
Non-Financial Benefits
1. Environmental Impact
- Reduced carbon footprint through optimized operations
- Enhanced environmental compliance
- Improved sustainability reporting
2. Competitive Advantage
- Market leadership in technology adoption
- Enhanced brand reputation
- Improved stakeholder confidence
Implementation Timeline
Phase 1: Planning and Preparation (3-6 months)
- Requirements analysis
- Vendor selection
- Initial staff training
- Pilot program design
Most of these costs can be eliminated using nfoldROI-4D Digital Twin as a Service (DTaaS)
Phase 2: Pilot Implementation (6-9 months)
- Equipment procurement
- System integration
- Staff training
- Initial deployment
- Performance monitoring
Most of these costs can be eliminated using nfoldROI-4D Digital Twin as a Service (DTaaS)
Phase 3: Full-Scale Deployment (12-18 months)
- Organization-wide implementation
- Process integration
- Advanced training
- Performance optimization
Most of these costs can be eliminated using nfoldROI-4D Digital Twin as a Service (DTaaS)
Risk Assessment
Technical Risks
- Data integration challenges
- System compatibility issues
- Technology obsolescence
- Cybersecurity concerns
Operational Risks
- Staff resistance to change
- Learning curve impacts
- Process disruption
- Data quality management
Mitigation Strategies
- Comprehensive training programs
- Phased implementation approach
- Regular stakeholder communication
- Strong vendor partnerships
- Continuous monitoring and optimization
Key Performance Indicators
Operational KPIs
- Asset inspection efficiency
- Maintenance response time
- Network optimization metrics
- Service interruption frequency
Financial KPIs
- Cost per inspection
- Maintenance cost reduction
- Revenue per customer
- Return on investment
Safety and Compliance KPIs
- Accident frequency rate
- Compliance violation rate
- Audit preparation time
- Risk incident frequency
Customer Service KPIs
- Service reliability metrics
- Customer satisfaction scores
- Response time metrics
- First-time resolution rate
Recommendations
1. Strategic Implementation
- Begin with pilot program in high-priority areas
- Establish clear metrics for success
- Develop comprehensive training program
- Create detailed data management strategy
2. Technology Selection
- Focus on scalable solutions
- Prioritize vendor stability and support
- Ensure compatibility with existing systems
- Consider future integration requirements
3. Change Management
- Develop comprehensive communication plan
- Establish clear governance structure
- Create feedback mechanisms
- Monitor and address staff concerns
Getting nfold ROI from Imagery/LIDAR Investment
Nearly all of these costs can be eliminated using nfoldROI-4D Digital Twin as a Service (DTaaS)
Customer cost
- documenting end-user requirements
- monthly/annual service subscription
nfoldROI cost
- Consulting
- Project Management
- Imagery/LIDAR data capture
- AI Imagery/LIDAR Feature extraction
- Post-processing
- QA/QC
- GIS Integration
- 4D Service/Platform Maintenance & Support
This approach introduces very large economies of scale shared with other customers – outsourcing all the specialised and expensive “back-office” work to the experts and allowing customers to concentrate on their core business by simply using the nfoldROI-4D Digital Twin as a Service (DTaaS)
Conclusion
- LIDAR technology represents a significant but worthwhile investment for utilities and telecommunications companies.
- The combination of operational efficiencies, risk reduction, and revenue enhancement opportunities provides a compelling business case for implementation.
- With proper planning and execution, organizations can expect to see positive returns within two years of deployment, while positioning themselves for future growth and innovation in their respective markets.

Imagery/LIDAR technology can significantly help electric utilities in several key areas:
Grid Infrastructure Mapping and Planning
- LIDAR provides highly accurate 3D mapping of terrain, vegetation, and existing infrastructure, allowing utilities to create precise digital models of their transmission and distribution networks
- Utilities can use these detailed maps to plan new grid routes, identify potential line expansions, and optimize infrastructure placement with unprecedented accuracy.
Vegetation Management
- LIDAR can detect vegetation encroachment near power lines with millimeter-level precision
- Utilities can create detailed vegetation height and density maps to:
- Predict potential interference risks.
- Plan targeted pruning and maintenance.
- Reduce the likelihood of power outages caused by tree-related incidents.
- Optimize vegetation management budgets by focusing efforts on high-risk areas.
Asset Inspection and Maintenance
- Drone-mounted or helicopter-mounted LIDAR can rapidly inspect transmission lines, towers, and substations.
- Provides detailed 3D imagery to identify:
- Structural damage
- Corrosion
- Mechanical wear
- Potential safety hazards
- Enables predictive maintenance strategies, reducing downtime and repair costs
Right-of-Way Management
- Helps utilities monitor and manage the land around transmission corridors
- Tracks change in vegetation, terrain, and potential encroachments.
- Supports compliance with safety regulations and easement requirements
Climate Resilience and Risk Assessment
- Creates detailed topographical models to assess:
- Flood risks
- Landslide potential
- Storm damage vulnerabilities
- Helps utilities develop more robust infrastructure planning and disaster response strategies
Renewable Energy Site Selection
- Assists in identifying optimal locations for solar and wind installations
- Provides precise terrain and elevation data to maximize energy generation potential
- It helps assess potential shading, wind patterns, and infrastructure connectivity
Environmental Compliance
- Supports environmental impact assessments
- Helps track ecological changes around utility infrastructure
- Assists in minimizing environmental disruption during grid development and maintenance
Electric utilities can leverage LIDAR technology to enhance operational efficiency, improve safety, reduce maintenance costs, and develop more resilient and intelligent grid infrastructure.
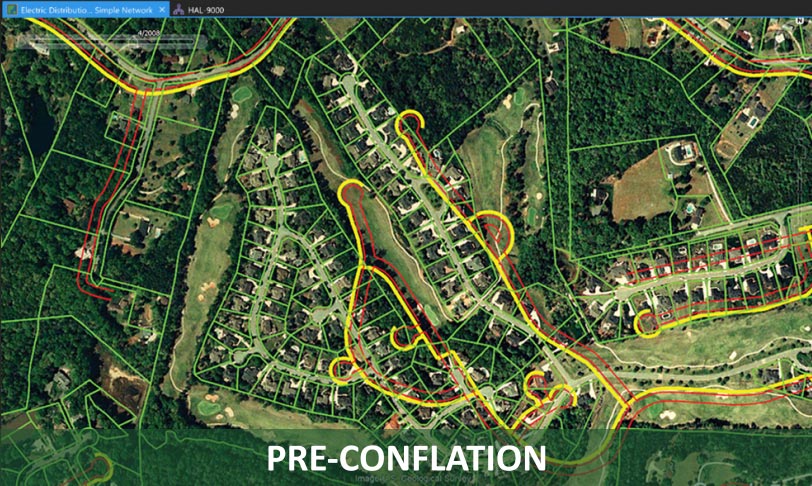
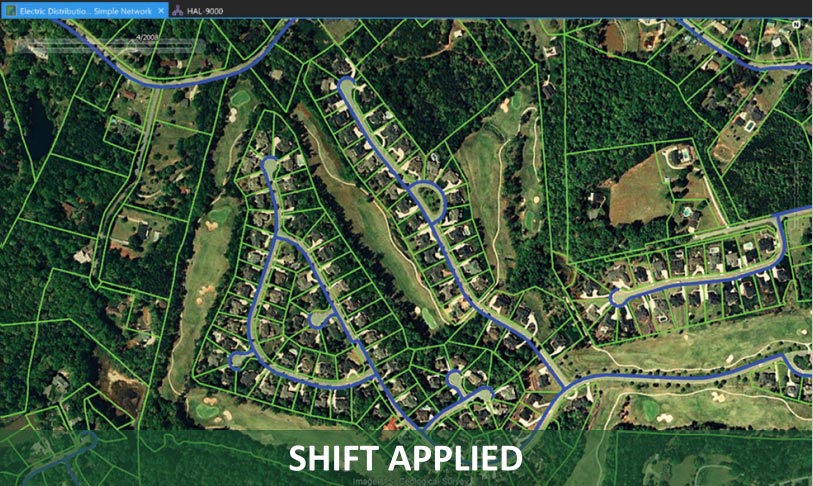
Utility Network Conflation
Utility network conflation is a process used to align and integrate different geospatial datasets to improve the spatial accuracy and data integrity of utility networks.
Our adjust.IT software available on Smallworld and Esri in the ArcGIS Market Place is the #1 Utility Network Conflation solution in the market. adjust.IT has the ability to
- use highly accurate LIDAR coordinates as effective Control Points
- effectively project manage Conflation for even the largest State or National GIS
- work in mixed Customer/Right-Shoring teams remotely
- conflate your utility network from 100’s of feet to centimetres
- create a true spatially accurate Digital Twin
- determine a mathematically rigorous result while maintaining the shape of the network through a least-squares best fit with residual spreading (unlike rubber-sheeting)
- scale to very large data sets solving 150,000 coordinates/second